Five years, six property markets, mixed fortunes

Last week, there was a brief discussion on thepropertypin of an interesting piece of economic history – in the 60 years following their construction in the late 1780s and early 1790s, the Georgian houses of Mountjoy Square fell in value by almost 94%. By comparison, nominal wages fell about 40%-50% during the same period, while the price of food – if bread is anything to go by – stayed largely the same (8 pence for a loaf of bread in the 1790s and in 1848). While I can’t claim to speak for anyone else reading, I would imagine the general perception was: “So property prices can adjust downward by percentages scarily close to 100% – but it probably takes a unique set of circumstances (Act of Union and all that).”

Yesterday, however, I read on Carpe Diem about the latest property price statistics from Detroit. Houses in Detroit are selling for an average of $11,500 at the moment, down an astonishing 88% from their peak values. That translates into a monthly mortgage payment of $50! And this happened not in 60 years of steady economic decline but in less than five years.

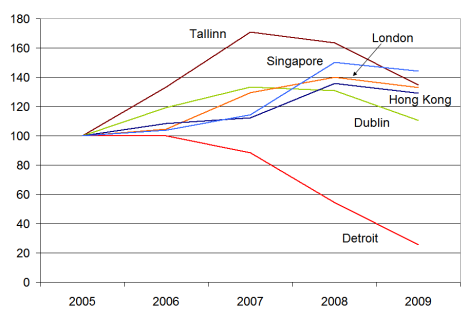
It got me thinking about Ireland’s property market in a global context, so I decided to do a little comparison of 2005-2009 for a smattering of cities. The cities were chosen in no particular way other than to give some global coverage, hence two Asian and one American cities, as well as two Western European and an Eastern European city. The figures refer to the start of the year concerned, with Jan 2005 set at 100 for all cities.

Property prices in six cities around the world, Jan 2005-Jan 2009

Property prices in six cities around the world, Jan 2005-Jan 2009

It was a slight surprise to see that, of the cities shown, none apart from Detroit had yet fallen below their Jan 2005 levels by the start of 2009. Indeed, some cities almost 50% above their 2005 levels. Dublin was closest – and more than likely has already fallen back to mid-2004 levels since the start of the year. Tallinn seems to be like an excess version of Dublin – rising and now falling faster. For Singapore and Hong Kong, 2007 seems to have been easily the craziest year, but the correction in 2008 was nowhere near as large. Meanwhile, Detroit props them all up.

For a view on how much more of a correction is needed for five economies, including the US, Ireland and Spain, you can have a look at property yields over the medium term here.

Is it cheaper to buy or rent?

Introducing the daft report earlier this year, Gerard O’Neill discussed the possibility that we might become a nation of renters. On the other hand, there is a lot of talk at the moment, particularly from those selling homes such as these guys in Palmerstown, about how it is significantly cheaper to buy than to rent. I thought it would be worth investigating this a little more, because at the end of the day, despite all the crazy economic goings-on of the past three years, people still have to make a decision about where and how to live. Is it cheaper to buy than rent, and if so by how much? How do things look now compared to the boom years and how will things look if house prices and rents continue to fall?

To do this, I had a look at average prices and rents for three-bedroom properties around the country from the start of 2006 on. I wanted to calculate the annual premium for owning your accommodation as opposed to just renting it, bearing in mind mortgage interest relief, prevailing interest rates and changing property values and rents. After all, economic theory would suggest that if you get to own the asset at the end of thirty years of living there, you should pay more than if you don’t.

The graph below shows the difference between renting and buying in annual terms for four regions – south County Dublin, Limerick, Dublin’s commuter counties and Connacht/Ulster outside of Galway. It’s calculated for a first-time buyer couple, with mortgage interest relief based on the first year of repayments. I’ve taken ECB+1% as the benchmark interest rate – something which of course may only hold for the first year.
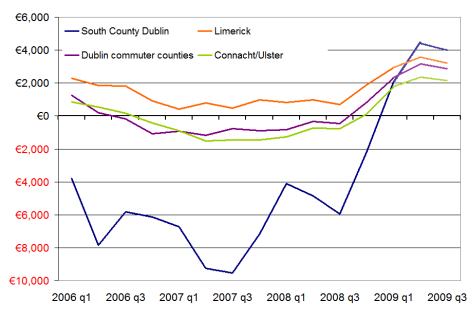
 

Annual savings for owning rather than renting, 2006-2009

Annual savings for owning rather than renting, 2006-2009

Even with property prices the way they were, it was cheaper to buy your house in 2006 than it was to rent it in everywhere around the country except South County Dublin. Generally, first-time buyers in Dublin could expect to save at least €2,000 over the course of their first year, while elsewhere they could expect to save about €1,000. Only in South County Dublin were first-time buyers actually paying any premium on ownership – in the order of €4,000 over the year for their three-bedroom home.

Sometimes I look back at 2005 and 2006 and wonder what we were all up to. Given those maths, it’s a bit easier to understand again. Of course, things didn’t stay that way. ECB rates started increasing and by mid-2007, potential first-time buyers were faced with the prospect of a premium on ownership in order of €1,000 over the first year – this at a time of uncertainty over capital values. In South County Dublin, the premium on home ownership for the first year was almost €10,000. It should be noted that in a couple of areas, South Dublin city (i.e. all areas with even postcodes), West Dublin and Limerick, it was cheaper to buy than rent – even when interest rates were at their highest. These areas have repeatedly exhibited the highest yields on residential property (about 4% over the past couple of years – high is relative).

Since late 2008, though, as lower interest rates have kicked in, there has been a dramatic swing in the maths back in favour of home-ownership. In late 2008, if you paid the asking price and got ECB+1% for your mortgage, you could expect to save €1,000 in most parts of the country – and more than €3,000 in Limerick or West Dublin. What’s worth noting is that this is at a time of rapidly falling rents as well as house prices. Looking at Q1 figures, that trend is growing with first-time buyers able to save in the region of €3,000 in their first year of ownership. Even in South County Dublin, a household will save money if they buy rather than rent.

How will these figures look in a year’s time? I’ve put in figures marked 2009 Q2 and Q3 to give an indication of how the buy-or-rent decision might look. I’ve assumed another 20% fall in house prices – that’s about a 40% fall from peak to trough. (If that sounds drastic, probably best not to read David McWilliams’ latest comparison of Ireland and Japan.) For rents, I’ve gone for 33% peak-to-trough fall (again, there are those who argue it could be more). In that scenario, buyers would continue be better off than renters in every part of the country. First-time buyers of three-bedroom properties would expect to save anywhere between €1,800 (West Leinster) and €7,000 (Dublin city centre).

To some extent, this is being driven by mortgage interest relief, which is greatest in Year 1. However, Q1 figures indicate that even if there were no mortgage interest relief, there are areas of the country where it is cheaper to buy than rent. And if house prices fall 40% from peak to trough, and rents fall 33%, it will be cheaper to buy than rent, even with no mortgage interest relief, in all areas of the country apart from South County Dublin.

What about the downside? If there are indeed significant swathes of vacant properties around the country that will continue to put pressure on rents for the next 3-5 years, could both rents and house prices halve from their peak values? If that were the case – meaning the typical three-bedroom home in south Dublin city would cost about €900 a month to rent or cost about €275,000 – the maths in favour of buying still look convincing in Dublin but elsewhere it’s a much tougher call. Without mortgage interest relief, homeowners would have to pay around €1,000 a year over what they’d pay to rent.

The tax system as it currently stands certainly strongly favours home ownership. If the government decides that the balance of emphasis when correcting its fiscal black hole should be on raising taxes rather than cutting expenditure, it may abolish mortgage interest relief and bring in a universal residential property tax. This could significantly alter the maths of buying versus renting and bring about the ‘nation of renters’. As it stands, though, even if rents were to halve over the coming year, the premium people pay to actually own their home appears too small for that to happen.

How many Irish homes are in negative equity?

Just over 500,000 thousand homes have been built since the start of 2002. Probably the same number again of second-hand homes have been bought in the same period. With the guts of one million properties having changed hands since 2002, how many of those are worth less than now than when they were bought? And how many owners find themselves owing more to the banks than they if they had to sell now?

Taking the daft.ie asking prices by county from 2006 on, and Dept of Environment regional figures before that, it’s possible to construct regional average prices going back in the 1980s. Fortunately, we don’t have to go back that far – but we do have to go back into the first half of this decade. By my calculations, of the half a million homes built since 2002, about 50% are now worth less than when they were bought. That’s based on current asking prices. If asking prices are – as some contend – about 10% above actual closing prices at the moment, the number of homes worth less now than when they were bought rises to 340,000 homes – or two thirds of the houses built since the start of 2002.

But that’s only half the story. Or slightly less actually, as loans for new homes account for just under 50% of all loans. If that ratio is correct, another 286,000 second hand homes now have asking prices less than the prices they were bought for. Again, if asking prices are 10% above what’s actually trading out there, that figure rises to about 382,500. In total, that represents about 725,000 homes that have been bought since 2004 that are now worth less. Depending on whether you take Census or Dept of the Environment figures, that represents between 37% and 43% of homes in the country. Put in plain English, two in five homes in Ireland are worth less now than when they were bought.

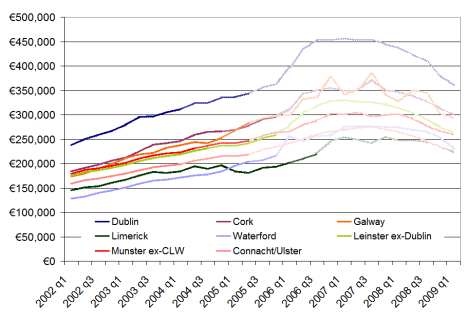
How far back has Ireland’s property market rewound? The graph below shows average home values in eight regions for the period 2002-2009. There are three shades of colour used – the lightest (further to the right) are house price gains that been wiped out, the medium shade represents current asking price levels, while the full colour lines represent asking prices less 10%. Overall, the asking price for the typical home in Ireland now is similar to what the home was worth in March 2005. If you believe asking prices are overstating true prices, the typical home in Ireland is now worth the same as it was in July 2004. The two years of bust have undone the last two and a half years of boom. Homes in Connacht and Ulster are worst affected – they are worth the same now as they were five years ago in early 2004.

When were Irish homes last worth what they're worth now?

When were Irish homes last worth what they're worth now?

Negative equity is, however, something more particular. It refers to the outstanding debt that someone owes the bank. In other words, if they sold the house now, would they be able to pay off the remaining debt from the sale price? Naturally, this is a much more complicated exercise. Dept of Environment figures suggest that the typical loan-to-value of new homes since 2002 has been about 75%, while for second-hand homes it’s been closer to 73%. Fortunately, the figures give something of a breakdown. Making some ballpark assumptions for different years, for example any 95%+ mortgage in 2004 or any 70%+ mortgage in 2007/2008, it’s possible to give a rough estimate of the number of homes in negative equity.

Roughly speaking, about half of the homes that are now worth less than when they were bought are in negative equity, in the financial sense of the word. (This makes intuitive sense, as two out of every five mortgages is less than 70%, suggesting a substantial amount of households with some equity still knocking around.) That’s 340,000 homes where if the homeowners have to sell, they will not be able to pay the bank back solely through the money they get from selling the house.

The punchline is that about one in five homes in Ireland is now in negative equity.

How many months supply is sitting on the property market?

The US leads the way for many types of statistics – and in particular for their timeliness. The housing market is no different, with a plethora of measures such as prices and volume of transactions out every month.

In Ireland, though, we have to labour under a dearth of timely statistics on a range of economic indicators – including the housing market. Naturally, the Daft Report tries to make its contribution, publishing one week after quarter’s end so that people have the latest asking price and stock/flow information. One that I’m increasingly asked for is the number of months of supply currently sitting on the property market, a measure that’s well established in the US. It’s probably time we tried to put some numbers on it.

To do that, we need to answer two questions. The first is: what is a normal volume of transactions for the Irish property market? The second is: how many are on the market now?

On the first, the natural way to go about it would be to use the recent level of transactions. The only problem with that, though, is that the number of transactions has fluctuated wildly over the past four years, making that a somewhat erratic measure. To counteract that, the Department of the Environment have a long-run series on loan approvals, which for all intents and purposes tells us how many people are buying property every year. The numbers still vary hugely over the past two decades, in line with the vicissitudes of Ireland’s property market. In 1990, there were just 35,000 transactions – less than 3,000 a month – while in 2005, there were over three times as many transactions, 120,000 in total.

Taking the 2005 figure – or indeed anything since about 2000 – leaves open the accusation that one is deliberately underestimating the problem by overestimating the “typical” month. Then again, anything pre-1999 – and certainly anything close to 1993 – is probably not too appropriate either. To overcome this, one can view the last 15 years of Ireland’s property market as two stylized periods: a (relatively) healthy property market in the 1990s, where monthly transactions averaged 4,400, and a hyperactive property market, 2000-2007, where monthly transactions averaged 7,800.

Using the 2000-2007 figure gives us a lower bound, while using the 1993-2000 gives an upper bound. Given that Ireland is the guts of 700,000 residents bigger now than in 1993 (even allowing for outward migration), it probably makes sense to use the average of the two figures (about 6,000 transactions a month) as some sort of post-2007 reasonable estimate of what one could expect would pass through the market in a healthy post-crunch Ireland.

To answer the second question, how many properties are currently on the market, I’ve taken the daft.ie series of stock of property for sale. An adjustment has been made, given the way new developments are listed on the site, to make sure that vacant new builds are better captured than the raw figures may suggest.

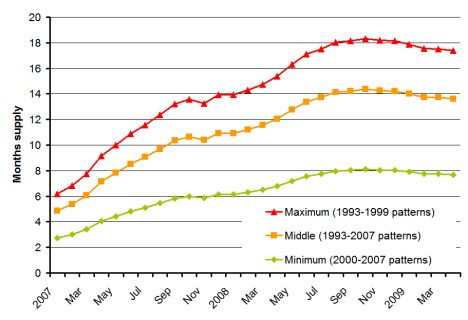
After all those preparations, where are we? The chart below shows the best estimate (orange) of the number of months property sitting on the market from early 2007 to April 2009 – alongside upper (red) and lower (green) bounds, based on whether one believes that the 2000-2007 level of transactions is ‘normal’ or in fact when everything dies down we’ll see a return to much lower 1993-1999 levels of transactions instead.

Estimated number of months supply on Ireland's property market

Estimated number of months supply on Ireland's property market

In a normal property market, one might expect to see three or four months supply sitting on the market – that’s about how long it takes for a property to go through the cycle of litsing, viewing, agreement, closure. The graph above – if you accept the middle ground presented – is that there has been a over a year’s supply of property sitting on the market since this time last year, compared to about 5 months at the start of 2007.

Good news? These days, good news is really just absence of new bad news! The good news is that while there is about three times as much property on the market as normal, this has levelled off – and indeed fallen slightly – in the last six months.