Five years, six property markets, mixed fortunes

Last week, there was a brief discussion on thepropertypin of an interesting piece of economic history – in the 60 years following their construction in the late 1780s and early 1790s, the Georgian houses of Mountjoy Square fell in value by almost 94%. By comparison, nominal wages fell about 40%-50% during the same period, while the price of food – if bread is anything to go by – stayed largely the same (8 pence for a loaf of bread in the 1790s and in 1848). While I can’t claim to speak for anyone else reading, I would imagine the general perception was: “So property prices can adjust downward by percentages scarily close to 100% – but it probably takes a unique set of circumstances (Act of Union and all that).”

Yesterday, however, I read on Carpe Diem about the latest property price statistics from Detroit. Houses in Detroit are selling for an average of $11,500 at the moment, down an astonishing 88% from their peak values. That translates into a monthly mortgage payment of $50! And this happened not in 60 years of steady economic decline but in less than five years.

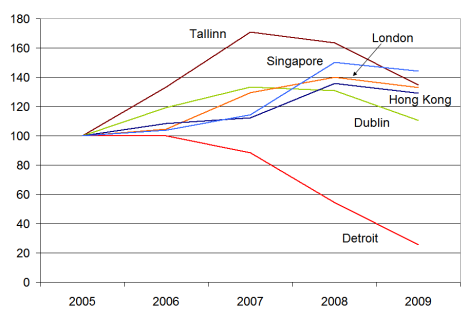
It got me thinking about Ireland’s property market in a global context, so I decided to do a little comparison of 2005-2009 for a smattering of cities. The cities were chosen in no particular way other than to give some global coverage, hence two Asian and one American cities, as well as two Western European and an Eastern European city. The figures refer to the start of the year concerned, with Jan 2005 set at 100 for all cities.

Property prices in six cities around the world, Jan 2005-Jan 2009

Property prices in six cities around the world, Jan 2005-Jan 2009

It was a slight surprise to see that, of the cities shown, none apart from Detroit had yet fallen below their Jan 2005 levels by the start of 2009. Indeed, some cities almost 50% above their 2005 levels. Dublin was closest – and more than likely has already fallen back to mid-2004 levels since the start of the year. Tallinn seems to be like an excess version of Dublin – rising and now falling faster. For Singapore and Hong Kong, 2007 seems to have been easily the craziest year, but the correction in 2008 was nowhere near as large. Meanwhile, Detroit props them all up.

For a view on how much more of a correction is needed for five economies, including the US, Ireland and Spain, you can have a look at property yields over the medium term here.

Taxpayers in Baltics, UK and Ireland facing the toughest questions

Two weeks ago, I examined the IMF’s estimates for growth prospects in 2009 and came to the conclusion that in a year where countries such as Afghanistan, Ethiopia and Laos are among the world’s fastest growing economies, more open economies are being hit by a collapse in the globalized consumer’s demand.

The temptation may be to regard this as a somewhat academic question but a closer examination of eurostat figures and the latest European Commission estimates for 2009-2010 shows why this has practical fiscal implications. Eurostat figures show that the EU’s budget deficit between 2000 and 2007 averaged just over 2%. Faster-growing countries such as Bulgaria, Estonia, Ireland and Sweden ran surpluses (Finland ran quite large surpluses in fact), while most of the Old Europe stalwarts, such as Germany, Italy and the UK, ran what would until recently have been termed sizeable budget deficits (i.e. greater than 2% on average).

The EU’s budget deficit grew from 0.8% in 2007 to 2.3% in 2008 and, according to the Commission, is set to almost treble this year to 6%. Next year, that deficit could increase even further to about 7% of EU GDP. Four countries face the prospect of their government balance undergoing a double-digit swing from what they were used to up to 2007 and what they will have to face in 2010 – Spain, the UK, Latvia and Ireland.

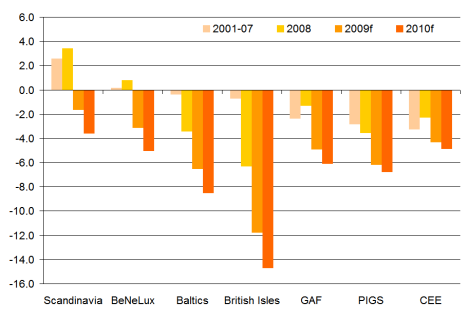
Given that foursome, I thought it might be worthwhile to see what groups there are within the EU – when it’s clear that the global trough has been reached, unanimity of purpose may pass, so these groups could have a political as well as economic relevance. The graph below shows mean budget deficits across seven relatively self-explanatory regions in the EU (GAF = Germany, Austria, France; PIGS = Portugal, Italy, Greece, Spain; CEE = Central & Eastern Europe). The regions are ordered from left to right by how ‘in balance’ the economies were from 2001 to 2007. What’s worth noting is that the ordering of the regions will have changed by next year – the Baltics and the British Isles (if I may call them that!) face significant budgetary deficits.

Budget deficits, 2001-2010, by EU region

Budget deficits, 2001-2010, by EU region

With more open economies being harder hit, their governments are facing pressure from all fronts. Alarming statistics are still coming in from places like Latvia, where output is down 30%, and Ireland, where tax revenues are down 24%. If exporters are being hit, their workers are likely to be hit – and the longer the recession goes on, the more workers will hold their consumption in check (not to mention unemployment).

The problem is that government deficits are the last point in the cycle – increasing taxes may have to wait unless the government wants to be responsible for second-round effects. This leaves Ireland in quite a conundrum, as its 2001-2007 tax base will not be coming back any time soon.