Five years, six property markets, mixed fortunes

Last week, there was a brief discussion on thepropertypin of an interesting piece of economic history – in the 60 years following their construction in the late 1780s and early 1790s, the Georgian houses of Mountjoy Square fell in value by almost 94%. By comparison, nominal wages fell about 40%-50% during the same period, while the price of food – if bread is anything to go by – stayed largely the same (8 pence for a loaf of bread in the 1790s and in 1848). While I can’t claim to speak for anyone else reading, I would imagine the general perception was: “So property prices can adjust downward by percentages scarily close to 100% – but it probably takes a unique set of circumstances (Act of Union and all that).”

Yesterday, however, I read on Carpe Diem about the latest property price statistics from Detroit. Houses in Detroit are selling for an average of $11,500 at the moment, down an astonishing 88% from their peak values. That translates into a monthly mortgage payment of $50! And this happened not in 60 years of steady economic decline but in less than five years.

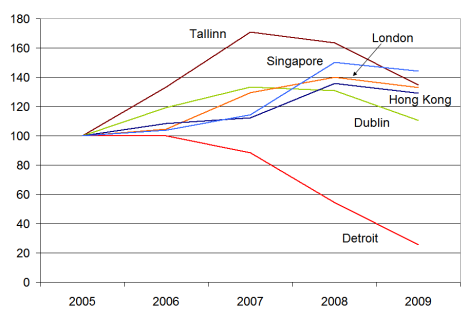
It got me thinking about Ireland’s property market in a global context, so I decided to do a little comparison of 2005-2009 for a smattering of cities. The cities were chosen in no particular way other than to give some global coverage, hence two Asian and one American cities, as well as two Western European and an Eastern European city. The figures refer to the start of the year concerned, with Jan 2005 set at 100 for all cities.

Property prices in six cities around the world, Jan 2005-Jan 2009

Property prices in six cities around the world, Jan 2005-Jan 2009

It was a slight surprise to see that, of the cities shown, none apart from Detroit had yet fallen below their Jan 2005 levels by the start of 2009. Indeed, some cities almost 50% above their 2005 levels. Dublin was closest – and more than likely has already fallen back to mid-2004 levels since the start of the year. Tallinn seems to be like an excess version of Dublin – rising and now falling faster. For Singapore and Hong Kong, 2007 seems to have been easily the craziest year, but the correction in 2008 was nowhere near as large. Meanwhile, Detroit props them all up.

For a view on how much more of a correction is needed for five economies, including the US, Ireland and Spain, you can have a look at property yields over the medium term here.

Where in Ireland has seen the biggest increase in unemployment?

My recent attempt to put some figures on the scale of negative equity in Ireland – which concluded that about 40% of Irish homes are worth less than when they were bought and that as many as 20% of homes may be in negative equity – sparked some discussion here, on thepropertypin and most thoroughly on irisheconomy.ie.

The original post was designed just to put some numbers on the potential problem of negative equity, leaving aside for the time being the implications. Two important strands of discussion have arisen about the implications. The first relates to financial consequences, as mentioned by Karl Whelan, particularly in relation to the proposed NAMA and the fate of the banks. The second broad strand of discussion, being led by Liam Delaney, relates to how negative equity has labour market implications, particular when unemployment is on the rise. (Unemployment and negative equity are mirror images of the home ownership/labour mobility discussion being led in the US by Richard Florida.)

I’m currently working on estimates of how many households are affected by the dual problem of unemployment and negative equity. Combined with the likelihood of falling rents over the coming two/three years, rents being the alternative income a homeowner could get from their house, this is a cocktail for widespread misery currently partially staved off by all-time low interest rates and therefore mortgage repayments.

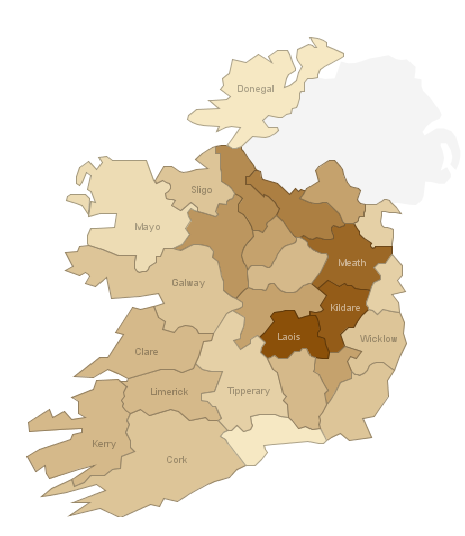
A next step in working out where both negative equity and unemployment will strike is looking in more detail at the problem of unemployment. The CSO provides very detailed statistics on unemployment by county/town and more occasional detail on the age profile and duration of unemployment. The map below gives an idea of ‘unexpected’ unemployment (original visualization here). It show the increase in those signing on by county in April 2009, compared to the average of 2005 and 2006, meant to indicate a natural level of unemployment (whether long-term or just switching jobs).

Unemployment in Ireland by county, April 2009 compared to 2005/2006

Unemployment in Ireland by county, April 2009 compared to 2005/2006

Those looking with relief at counties in a light brown – such as Waterford, Louth, Donegal and Mayo – should be aware that in all counties, the April 2009 was at least twice the 2005/2006 average. What’s more worrying, though, is that there are a number of counties where unemployment is three times what it was three years ago. In Meath and Kildare -stalwarts of Dublin’s commuter belt – unemployment has more than trebled. Likewise in Cavan and Laois.

The next part of the puzzle is to revisit county-level estimates of negative equity based on comments on the last set of figures and then try to put some numbers on how many households finds themselves faced with both unemployment and with a house worth less than their debt to the bank.

Irish house prices fall 4% since the start of 2009 – latest daft.ie report

Ireland’s property slump marked it second birthday today, with the news from the latest daft.ie report that asking prices for residential property fell 4.2% in the first three months of 2009. This latest drop in prices marks the eight consecutive quarter that prices have fallen.

As the official press release notes, the national average asking price now stands at just over €280,000, meaning that prices have fallen almost €70,000 from the peak in early 2007. What’s interesting to note at this stage is that Dublin was worse hit on average over the first quarter – in particular Dublin city centre, where prices fell by 11%. Other notable falls since the start of the year are Sligo and Waterford city, where prices fell by about 10% in three months.

The fall in the first three months of the year should not be underestimated, particularly as the year-on-year rate of change has now slid to -15.7%. Nonetheless, a graph of the quarterly change in asking prices gives some food for thought. The falls in house prices got worse and worse more or less every quarter from mid-2007 on – until now, as the diagram below shows. How much we can read into this, though, will have to wait until next quarter, when we can see if the trend continues.
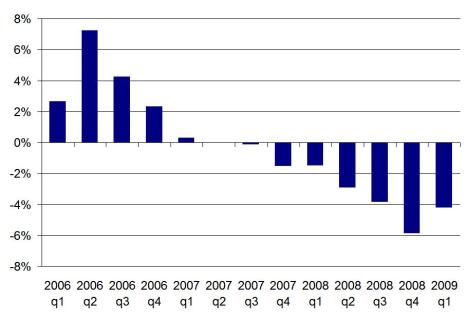
Change in national average asking price from quarter before, source: daft.ie

Change in national average asking price from quarter before, source: daft.ie

Commentator for this report is Liam Delaney, a behavioural economics expert. He discusses the importance of psychology – and the value in terms of self-worth of things like owning a house or having a job – in current economic conditions. He draws an important distinction between public and private sector workers (or at least that’s how I interpret it):

This report – combined with the recent labour force figures – indicates considerable hardship for those in once solid middle-class jobs that are now facing a potential double-whammy. People will inevitably feel even worse when they see neighbours and friends who are in better situations. Consider the position of a college graduate who purchased in Dublin in 2006, based on the income from his financial services job (now gone), to the position of his neighbour who secured a public sector position on leaving college and purchased in 2001. While neither is laughing, the latter must at least be considering himself the better off of the two. They are certainly not in the same boat and the widening rift in society being generated by asset price decline and employment uncertainty is the defining theme of our time. As described by John Fitzgerald and others, there are many who are currently better off than last year, as they are facing declining prices and interest rates in the context of stable employment in their sector.

He also describes two scenarios for the future, drawing on Gerard O’Neill‘s own commentary on a previous Daft report, where he suggested that the current economic maelstrom in which Ireland finds itself is probably the only thing that could possibly ever turn Ireland into a nation of renters – the implication being that may just happen. Liam then walks through the implications of these two scenarios:

One version of a national narrative that was articulated in the previous commentary by Gerard O’Neill was the idea that the Irish cultural and psychological need for property may be displaced by a culture where renting is given more credence as part of a normal adult life. Were such a story about the Irish relation to property to take hold, it would clearly have substantial implications for any potential future rebound in property prices. Key players at the moment are those who can afford property but are riding out the current uncertainty by taking advantage of falling rents. If they follow Gerard’s story, they may never come back into the buying market and the next generation may follow them into long term renting.

Yet, we still hear strongly the story that the Irish have always been and will always be wedded to the idea of home ownership as a fundamental part of maturing into adulthood. If such a story about Irishness and adulthood maintains its hold, house prices will eventually settle at a higher level, and changes in the market will depend on macroeconomic conditions, rather than on the type of seismic shift in Irish culture described by Gerard.

I’ll be posting each day this week on different findings from the latest figures, starting tomorrow with a Budget-day special… did someone say an Irish property tax? Later in the week, I’ll also look at the stock of property for sale – which incidentally has now fallen, however slightly, each of the last six months – but before I do, a quick comment on asking prices versus closing prices. Accurate measurement of house prices is a hot topic at the moment – it seems the ptsb closing price index reached a minimum fall in year-on-year terms of 10%, while asking prices haven’t yet found their nadir.

Changes in asking and closing prices, 2007-2009

Changes in asking and closing prices, 2007-2009

The full report is available at www.daft.ie/report and contains, as mentioned above, a commentary by Liam Delaney, Lecturer in Economics with the Geary Institute, UCD, as well a regional and county-by-county analysis of the latest trends in the property market.

Hair of the dog: With rents fallings, ECB cuts the only thing likely to drag yields above borrowing cost

The third and final (for 2008 anyway) instalment in the visualizations of Ireland’s property market takes a different look again to my recent posts on trends in prices and stock. Building on the measure of affordability on page 10 of each daft.ie rental report and a suggestion made on thepropertypin.com, it measures the gap between the expected yield and the cost of borrowing.

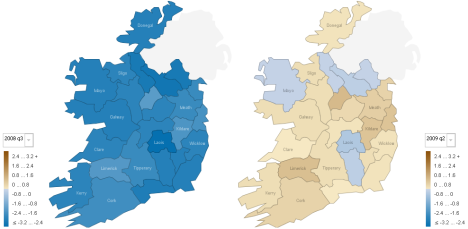
The result is here on Manyeyes. Blue means the cost of borrowing is greater than the expected yield, while brown means the opposite. Below, two quarters are shown – 2008 q3 and an estimate for 2009 q2.

The gap between the cost of borrowing and property yields in Ireland, 2008 q3 and an estimate for 2009 q2

The gap between the cost of borrowing and property yields in Ireland, 2008 q3 and an estimate for 2009 q2

What is clear is if that one takes a measure of this gap as a measure of market disequilibrium, the market remains overpriced. (There are of course plenty of reasons why rents as a proportion of house prices may not be the only measure of a housing market in balance, particularly where rental markets are small or negligible, but bearing that in mind, let’s proceed…)

To look ahead and see if this mass of blue is likely to change any time soon, I made some assumptions about interest rates, asking prices and rents, based on what we know now. I assumed that interest rates fall to 1.5% in June 2009, and that house prices and rents both fall 5% quarter-on-quarter in the first six months of next year, as high levels of stock in both segments take their toll. I’ve also assumed landlords will still get 11 months of the 12 in rent and that the rate at which first-time buyers borrow remains about 1.1% above the ECB rate.

I’m sure there are plenty of ways people might disagree with particular aspects of those assumptions, but I think they make, if nothing, else a starting point for discussion. (Take them as a straw man if you don’t like them!) Anyway, if those assumptions were to be borne true over the coming six months, the first thing to note is that yields would be largely unaffected – i.e. not going in the direction they should be, up towards the equilibrium long-term average cost of borrowing somewhere north of 4%. (It should be pointed out at this stage that yields in certain market segments, e.g. West Dublin 1-beds, are already very close to 5%, so averages certainly hide some interesting sub-county variations. For more check out page 10 of the last Daft.ie report.)

However, a collapse in interest rate – albeit gradually – in a steady-as-she-goes ECB version of the Fed’s record peak to trough interest rate journey would have the not unexpected consequence of turning all those blue spots brown. Well, most of them anyway. Once again, the prognosis is not good for Leitrim and Cavan, two of the counties with among the worst stock overhang in the country, on a per capita basis. Even with interest rates collapsing to record lows, that would not be enough to make the rate of return on property greater than the cost of borrowing.

Is the cure the world is adopting a central banker’s version of the hair of the dog that bit you? Or are we entering a phase of the world economy where caution is so predominant that low interest rates are the appropriate response?

Ireland’s property overhang: Homeowners in Roscommon, Cavan and Leitrim beware

Last week, I posted a visualization of changes in asking prices for Irish property, since 2006, using the IBM Manyeyes tool. It’s proved very popular, not least with the crowd on thepropertypin.com. I’ve been happy to take suggestions on what’s the most important thing to be mapping and one suggestion – which ties in nicely with some ideas I’d been working on – was to measure the number of properties for sale by county, per capita.

What I’ve done for today’s visualization is take the number of permanent households from the 2006 Census – and taken it as fixed. I then plugged in county-level figures for the stock of property for sale from the Daft.ie database, and used the two to calculate an approximate percentage of the total property stock in a county that’s currently for sale. There are a range of potential data issues, from taking the Census figures as fixed to how to capture the size of new developments – it’s my hope that while all those issues are valid ones, the overall story should be relatively clear.

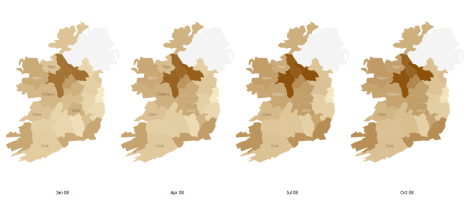
As before, the results are available for all to see and download on Manyeyes. It’s probably pretty clear what the overall message is, though, from the preview below (click on the picture to go through to Manyeyes):

Percentage of properties for sale, by county, Jan-Oct 2008

Percentage of properties for sale, by county, Jan-Oct 2008

Some initial thoughts:

  • First off, Dublin seems among the least affected areas.
  • “Holiday home land”, i.e. counties like Wexford, Kerry, Cork, Donegal and Galway, have seen their overhang increase over the course of the year, but again, they are not the worst affected areas.
  • A trio of counties, Roscommon, Cavan and Leitrim, however, steal the show. Those three, as of start-October, had more than 10% of their properties for sale.

Data on how many properties have churned through the market since the start of 2007 would probably confirm that the hysteresis which has gripped the Irish property market is worst in some of the areas where the property boom probably reached its most irrational. As before, all comments, questions and thoughts welcome.